Ever found yourself needing to quickly gauge opinions or satisfaction levels without overwhelming respondents with complicated questions? That’s where a simple, yet incredibly effective, 1 to 10 rating scale comes into play. It’s a fantastic tool for collecting clear, quantifiable feedback, making it a go-to choice for researchers, businesses, and educators alike. Whether you’re assessing product usability, customer service interactions, or even the success of an event, this scale offers a straightforward way for people to express their views.
The beauty of the 1 to 10 scale lies in its simplicity and versatility. It provides enough nuance for respondents to differentiate their feelings, unlike a basic yes/no, but isn’t so granular that it becomes difficult to decide, like a 1 to 100 scale. This balance makes it highly intuitive, leading to higher completion rates and more reliable data. If you’re looking to create a quick and impactful survey, understanding how to best utilize a 1 to 10 rating scale survey template is your first step.
Why the 1 to 10 Rating Scale Is Your Feedback Superpower
When it comes to gathering feedback, clarity and ease of use are paramount. The 1 to 10 rating scale excels on both fronts. It offers a broad spectrum for responses, allowing individuals to pinpoint their exact level of agreement, satisfaction, or frequency. Think about it: if someone is “somewhat satisfied,” a 1 to 5 scale might force them into a 3 or 4, but a 1 to 10 scale lets them choose a 6 or 7, providing a more precise insight into their experience. This granularity, without being overly complex, helps you capture more accurate data.
Furthermore, this scale is universally understood. People are accustomed to rating things on a scale of 1 to 10, from movie reviews to personal performance assessments. This familiarity reduces the cognitive load on your respondents, meaning they can answer quickly and confidently. High confidence in responses translates to better quality data for you, which is crucial for making informed decisions. It also makes comparisons across different segments or time periods much simpler, as the numerical data is inherently quantifiable.
Perhaps one of the greatest advantages of using a 1 to 10 scale is its analytical power. The numerical output allows for robust statistical analysis. You can easily calculate averages, medians, and modes, track trends over time, and even perform more complex regression analyses to understand what factors influence ratings. This makes it an incredibly powerful tool for everything from market research to internal process improvements.
Ultimately, incorporating a 1 to 10 rating scale into your feedback collection strategy simplifies the process for both you and your respondents, leading to richer insights. It’s a robust framework that can be adapted to countless scenarios.
Common Applications of the 1 to 10 Scale
- Customer Satisfaction (CSAT): “On a scale of 1 to 10, how satisfied were you with our service today?”
- Employee Engagement: “On a scale of 1 to 10, how likely are you to recommend our workplace to a friend?”
- Product/Service Feedback: “On a scale of 1 to 10, how easy was it to use our new feature?”
- Event Feedback: “On a scale of 1 to 10, how would you rate the overall quality of the conference?”
- Content Usefulness: “On a scale of 1 to 10, how useful did you find this article?”
Crafting Your Perfect 1 to 10 Rating Scale Survey Template
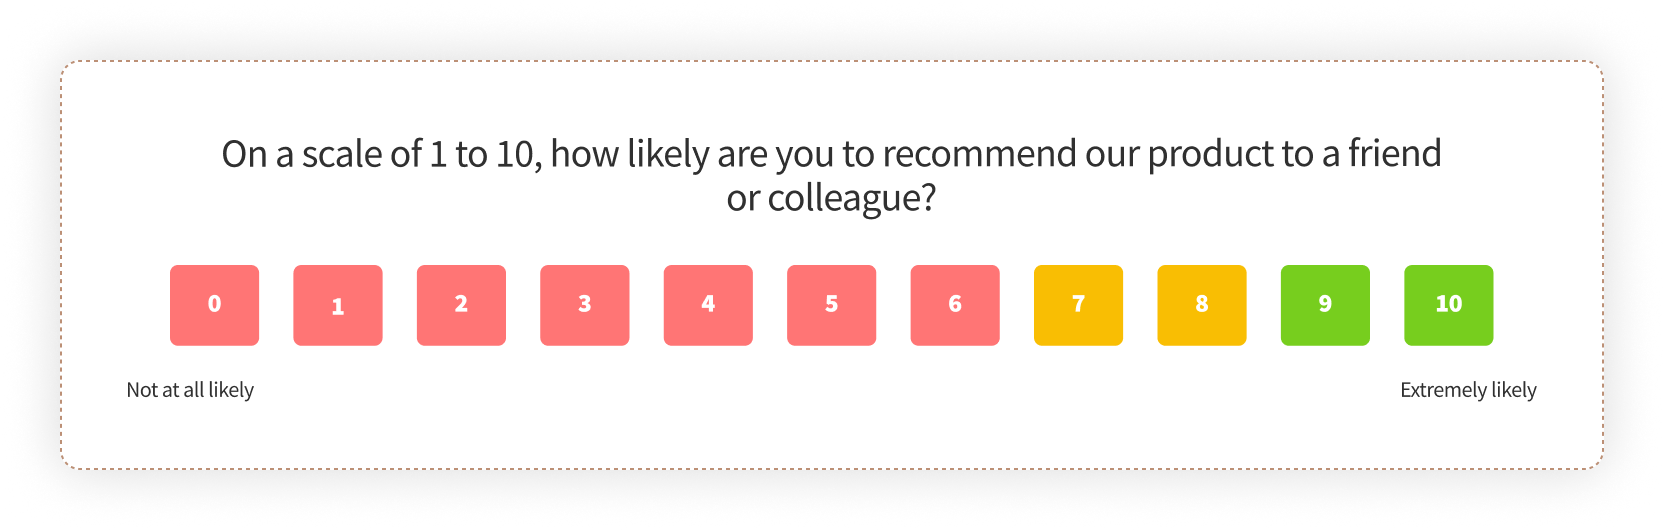
Designing an effective 1 to 10 rating scale survey template isn’t just about throwing numbers on a page; it’s about thoughtful question phrasing, clear labeling, and considering the respondent’s experience. Start by defining what 1 and 10 truly represent. Is 1 “extremely poor” and 10 “excellent,” or “not at all likely” versus “extremely likely”? Being explicit about these anchors helps standardize responses and reduces ambiguity. Without clear definitions, different people might interpret the scale differently, leading to less reliable data.
The phrasing of your question is equally important. Keep it concise, unambiguous, and focused on a single concept. Avoid double-barreled questions that ask about two things at once, as this can confuse respondents and lead to inaccurate ratings. For instance, instead of asking “How satisfied were you with the product and its delivery?” ask two separate questions: “How satisfied were you with the product?” and “How satisfied were you with the delivery?” This ensures each rating pertains to a specific aspect.
Consider the context in which your survey will be administered. Is it online, in-person, or via a mobile app? Ensure the visual presentation of the scale is clean and easy to read across different devices. For digital surveys, interactive elements like sliders or clickable stars can enhance the user experience, making the survey feel more engaging and less like a chore. Accessibility is also key; make sure your template is usable by everyone, regardless of their technical proficiency or any visual impairments.
Finally, think about how you’ll present the results. A well-designed 1 to 10 rating scale survey template doesn’t just collect data; it sets the stage for meaningful analysis. Will you look at average scores, distribution of responses, or perhaps correlate ratings with other demographic information? Having a plan for analysis beforehand can help you fine-tune your questions to ensure you collect the most pertinent information for your objectives. Regularly reviewing and refining your templates based on response rates and data quality can also significantly improve future feedback collection.
- Clear Anchors: Always define what the lowest (1) and highest (10) points on your scale mean.
- Specific Questions: Each question should focus on a single, clear concept to avoid confusion.
- Consistent Wording: Use similar phrasing for similar questions to maintain coherence.
- Visual Simplicity: Design the scale to be clean and easy to understand visually.
- Testing: Pilot test your survey with a small group to catch any ambiguities or technical issues before a full launch.
Implementing a 1 to 10 rating scale offers a powerful and flexible way to gather quantifiable insights from your audience. Its simplicity ensures high participation, while its numerical output provides a solid foundation for data-driven decisions. By thoughtfully crafting your questions and clearly defining your scale, you can unlock valuable feedback that truly informs your strategies and improvements. It’s a tool that empowers both the survey creator and the respondent, leading to a more effective feedback loop.
The ease with which you can deploy and analyze data from such a scale makes it an indispensable asset for continuous improvement. Whether you’re tracking customer loyalty, assessing content effectiveness, or gauging employee morale, the insights gained can guide meaningful action. Embracing this straightforward yet robust method can significantly enhance your ability to understand perceptions and drive positive change within your organization or project.


