Ever tried to gather opinions or feedback but found yourself overwhelmed by open-ended answers that were hard to compare? Or perhaps you needed a simple, straightforward way to understand satisfaction levels, product preferences, or service quality? That is where the trusty 1 to 5 scale comes into its own. It is a wonderfully intuitive tool, widely used across various fields because of its simplicity and effectiveness in turning subjective opinions into measurable data. Think about every time you have rated a movie, a customer service experience, or even a podcast episode – chances are, you have used a scale much like this one.
Creating a good survey does not have to be complicated, especially when you have a clear framework in mind. This article will walk you through everything you need to know about crafting and utilizing a powerful 1 to 5 scale survey template. We will explore why these scales are so popular, how to design questions that yield meaningful insights, and common pitfalls to avoid so your data is as clear and actionable as possible. Get ready to transform your feedback collection process into something truly efficient and insightful.
Why the 1 to 5 Scale is Your Go To for Feedback
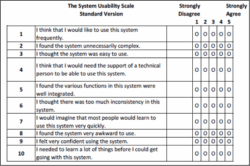
You know, there is a reason the 1 to 5 scale has become such a staple in surveys across the board. It is just incredibly easy for people to understand and respond to, making it an excellent choice for a wide variety of data collection needs. When you ask someone to rate something from 1 to 5, where 1 might mean “Strongly Disagree” and 5 means “Strongly Agree,” there is very little ambiguity. This clarity helps respondents quickly process the question and select an answer, which in turn leads to higher completion rates for your surveys. Plus, it is universally recognized, so you do not have to spend time explaining the mechanics to your audience.
Another fantastic benefit of using a 1 to 5 scale is its ability to quantify qualitative data. Imagine trying to analyze hundreds of written comments about customer satisfaction. It would be a monumental task to identify trends and compare sentiments. However, with a 1 to 5 scale, you instantly get numerical values that can be averaged, charted, and compared over time or across different groups. This makes data analysis much more streamlined and allows you to spot patterns and make data-driven decisions far more efficiently. It is all about transforming subjective feelings into objective numbers, giving you a clear snapshot of reality.
The versatility of this scale also cannot be overstated. Whether you are a small business owner trying to gauge customer happiness, a teacher looking for student feedback on a lesson, or a researcher evaluating perceptions of a new product, a 1 to 5 scale can be adapted to fit almost any context. You can use it to measure satisfaction, agreement, frequency, importance, or even likelihood. The key is simply defining what each number on the scale represents in relation to your specific question. This adaptability makes it a powerful and reliable tool for a multitude of scenarios where you need quick, comparable insights.
Finally, using a consistent 1 to 5 scale survey template helps in creating standardized data collection over time. If you use the same scale for recurring surveys, you can easily track changes and improvements or identify areas of decline. This longitudinal data is invaluable for understanding trends, measuring the impact of changes you implement, and demonstrating progress. It removes the guesswork and provides a clear, numerical benchmark for evaluation. It is like having a consistent measuring tape for opinions, ensuring that every piece of feedback can be directly compared with previous ones.
Common Applications of the 1 to 5 Scale
- Customer Satisfaction: How satisfied are you with our service today? (1 Very Dissatisfied to 5 Very Satisfied)
- Product Feedback: How easy was this product to use? (1 Very Difficult to 5 Very Easy)
- Employee Engagement: I feel valued at my workplace. (1 Strongly Disagree to 5 Strongly Agree)
- Event Evaluation: How relevant was the content of this workshop? (1 Not Relevant at All to 5 Extremely Relevant)
- Service Quality: Please rate the cleanliness of the facilities. (1 Poor to 5 Excellent)
Crafting Your Own Effective 1 to 5 Scale Survey Template
Now that we have talked about why the 1 to 5 scale is so great, let us dive into how you can put together your very own effective 1 to 5 scale survey template. The process starts with a clear objective. Before you even think about writing questions, ask yourself: what specific information do I need to gather? What decision am I hoping to make based on this feedback? Having a crystal-clear goal will guide your question development and ensure that every item on your survey contributes to achieving that objective. Without a defined purpose, your survey might collect a lot of data, but very little of it will be truly actionable.
Next, focus on formulating your questions. They should be clear, concise, and unambiguous. Avoid jargon or technical terms that your audience might not understand. Each question should ideally focus on one specific concept to prevent confusion and ensure accurate responses. For instance, instead of asking, “How satisfied were you with the product and its delivery?”, break it down into two separate questions: “How satisfied were you with the product?” and “How satisfied were you with the delivery service?”. This ensures that respondents are rating distinct aspects, giving you more granular and useful feedback.
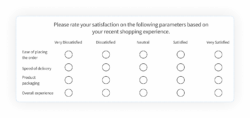
Defining your scale points is equally crucial. While “1 to 5” is the range, what do 1, 2, 3, 4, and 5 actually mean in the context of your question? These labels, often called anchors, should be descriptive and consistent. For example, for satisfaction, you might use “1 = Very Dissatisfied, 2 = Dissatisfied, 3 = Neutral, 4 = Satisfied, 5 = Very Satisfied.” Ensure there is a logical progression and that the middle point (3) accurately represents a neutral or indifferent option. Avoid using vague terms that could be interpreted differently by various respondents.
Consider the neutrality of your scale. The middle option, number 3, often serves as a neutral point. Including a neutral option is generally good practice as it allows respondents who genuinely have no strong opinion, or for whom the question does not apply, to select an answer without being forced to lean one way or another. Excluding a neutral option can force a choice, potentially skewing your results. However, there are times when you might want to force a choice, such as in certain voting scenarios, but for general feedback, a neutral option usually enhances data accuracy.
Finally, always, always, pilot test your survey with a small group before sending it out widely. This step is incredibly important for catching any unclear questions, confusing scale points, or technical glitches. A pilot test helps you refine your survey, ensuring that your 1 to 5 scale survey template is performing exactly as intended and that the data you collect will be reliable and easy to interpret. Think of it as a dress rehearsal, giving you the chance to iron out any wrinkles before the big show.
Employing a 1 to 5 scale is a remarkably effective way to gather quantifiable feedback that can guide your decisions and improve your offerings. Its inherent simplicity for respondents translates into rich, comparable data for you, whether you are assessing customer sentiment, gauging employee satisfaction, or evaluating program effectiveness. By carefully crafting your questions and clearly defining your scale points, you can unlock a wealth of insights that might otherwise remain hidden in qualitative comments.
Ultimately, the power of a well-designed 1 to 5 scale survey lies in its ability to provide a clear, numerical snapshot of opinions and experiences. It empowers you to track progress, identify areas needing attention, and make informed adjustments with confidence. This straightforward yet powerful tool is truly indispensable for anyone looking to understand their audience better and drive continuous improvement.


