Ever found yourself wondering if your software, website, or even a new gadget is truly user-friendly? It’s a question that plagues countless developers, designers, and product managers. While gut feelings are nice, objective data is king when it comes to understanding how people interact with your system. This is precisely where a robust measurement tool comes into play, helping you quantify the elusive concept of “usability” in a reliable and easy-to-understand way. And among the various methods available, one stands out for its simplicity, versatility, and widespread acceptance: the System Usability Scale.
The System Usability Scale, often abbreviated as SUS, provides a quick and effective way to assess the perceived usability of a product or service. It’s a tried-and-true method that has been around for decades, proving its worth across countless industries and applications. If you’re looking to gather valuable feedback that can drive improvements and enhance user satisfaction, understanding and implementing the SUS is a fantastic first step. We’re going to dive into what makes this scale so powerful and how you can leverage a system usability scale survey template to streamline your own research efforts.
What Exactly is the System Usability Scale (SUS)?
The System Usability Scale was originally developed by John Brooke in 1986 while working at Digital Equipment Corporation. Its primary purpose was to provide a quick and dirty, yet reliable, tool for assessing the usability of various systems. Despite its age, it remains incredibly popular due to its ease of use, general applicability, and robust results. It’s truly a testament to its design that it has stood the test of time, becoming a go-to metric for UX professionals, researchers, and product teams across the globe, from small startups to large enterprises.
One of the main reasons for the SUS’s widespread adoption is its simplicity. It consists of just 10 statements, which respondents rate on a 5-point Likert scale, ranging from “Strongly Disagree” to “Strongly Agree.” This straightforward approach makes it incredibly quick for users to complete, often taking less than two minutes. This brevity helps reduce survey fatigue and encourages higher completion rates, ensuring you get more data from your target audience. Plus, its generic nature means it can be applied to almost any system, whether it’s a mobile app, a website, an interactive voice response system, or even a physical product.
The magic of the SUS lies in its clever construction. Five of the statements are positively worded, and five are negatively worded. This alternation helps to avoid response bias, ensuring that participants read each statement carefully rather than falling into a pattern of simply agreeing or disagreeing with everything. After collecting the responses, there’s a specific scoring method that converts the raw scores into a single number between 0 and 100, which represents the perceived usability of the system. This normalized score makes it easy to compare the usability of different systems or track improvements over time.
The 10 SUS Statements You’ll Encounter
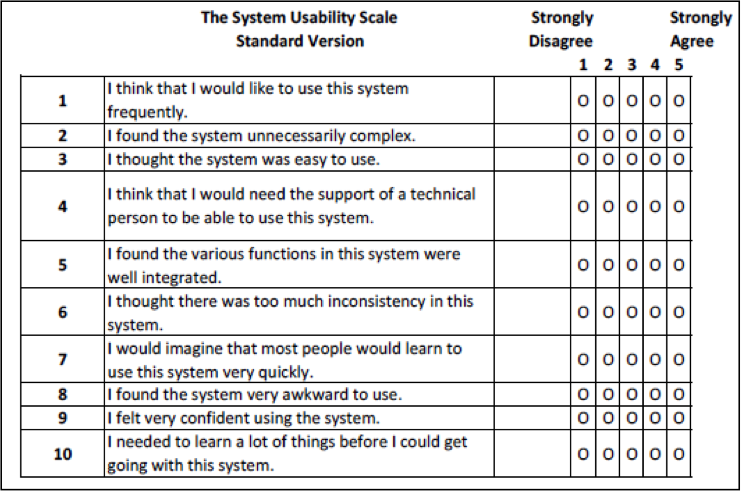
To give you a clearer picture, here are the 10 standard statements that form the core of any System Usability Scale survey:
- I think that I would like to use this system frequently.
- I found the system unnecessarily complex.
- I thought the system was easy to use.
- I think that I would need the support of a technical person to be able to use this system.
- I found the various functions in this system were well integrated.
- I thought there was too much inconsistency in this system.
- I would imagine that most people would learn to use this system very quickly.
- I found the system very cumbersome to use.
- I felt very confident using the system.
- I needed to learn a lot of things before I could get going with this system.
Once you have responses to these statements, a simple calculation (involving converting scale points and summing them) gives you your final SUS score, which provides an excellent snapshot of user perception regarding your system’s usability. A score above 68 is generally considered above average, with higher scores indicating better usability.
Building Your Own System Usability Scale Survey Template
Creating your own system usability scale survey template is a smart move for anyone looking to regularly assess user experience. Having a pre-prepared template saves you significant time, ensures consistency across your studies, and helps you standardize your data collection process. Instead of starting from scratch every time, you’ll have a ready-to-deploy tool that just needs to be integrated into your chosen survey platform and distributed to your participants. This efficiency allows you to focus more on analyzing the results and less on the setup.
When you’re putting together your system usability scale survey template, there are a few key considerations beyond just the 10 statements themselves. First, think about the platform you’ll use (e.g., Google Forms, SurveyMonkey, Qualtrics). Ensure your template is compatible with its features. Second, clear instructions for your participants are paramount. Explain the purpose of the survey briefly and assure them of anonymity if applicable. You might also want to include a few demographic questions at the beginning or end, such as age, gender, or experience level, to help you segment your data later on.
Consider also adding an optional open-ended feedback section at the very end of your template. While the SUS provides a quantitative score, qualitative comments can offer invaluable context and insights into why users rated certain aspects the way they did. This section allows users to elaborate on specific pain points or express what they particularly liked, giving you actionable feedback that goes beyond just a number.
- **Clarity of Instructions:** Make sure users understand how to complete the survey and what the ratings mean.
- **Anonymity Assurance:** Reassure participants that their responses are anonymous to encourage honest feedback.
- **Optional Qualitative Feedback:** Include a text box for comments to gather deeper insights.
- **Demographic Questions (Optional):** Add questions about user background if relevant for data segmentation.
Once your template is ready, administering it effectively is the next step. Conduct a small pilot test with a few internal users or friends to iron out any kinks. When it’s time for real users, clearly define your target audience and recruit participants who closely match them. Remember, a well-designed system usability scale survey template is just the starting point; the real value comes from careful administration, thoughtful analysis of the results, and, most importantly, acting on the insights gained to make your product truly better for your users.
Ultimately, incorporating the System Usability Scale into your product development lifecycle is a straightforward yet impactful way to gauge and improve the user experience. Its quick completion time, reliability, and ease of interpretation make it an invaluable tool for anyone serious about creating intuitive and enjoyable systems. By regularly deploying this simple, 10-item questionnaire, you gain a clear, quantitative measure of how users perceive your product’s usability.
Understanding your SUS score allows you to benchmark against industry standards, track progress over iterative design cycles, and identify areas that need attention. It’s an effective method to ensure your efforts are leading to genuinely more usable products, fostering better user satisfaction, and ultimately contributing to the success of your offerings in a competitive digital landscape. Keep testing, keep iterating, and keep improving!


