When it comes to gathering feedback, understanding opinions, or gauging satisfaction, surveys are an invaluable tool. And among the myriad of question formats available, the 1-5 scale stands out as a universally recognized and highly effective method. It’s simple, intuitive, and provides a clear spectrum for respondents to express their thoughts, making it a cornerstone for anyone looking to collect structured data without overwhelming their audience.

This numerical scale, often associated with the Likert scale, allows for quick quantification of qualitative data, transforming abstract feelings into measurable insights. Whether you’re assessing product satisfaction, employee engagement, or service quality, a well-designed survey incorporating a 1-5 scale can offer profound understanding. The beauty lies in its straightforwardness, enabling respondents to swiftly make choices while providing researchers with a clear path for analysis.
Crafting Effective 1-5 Scale Questions
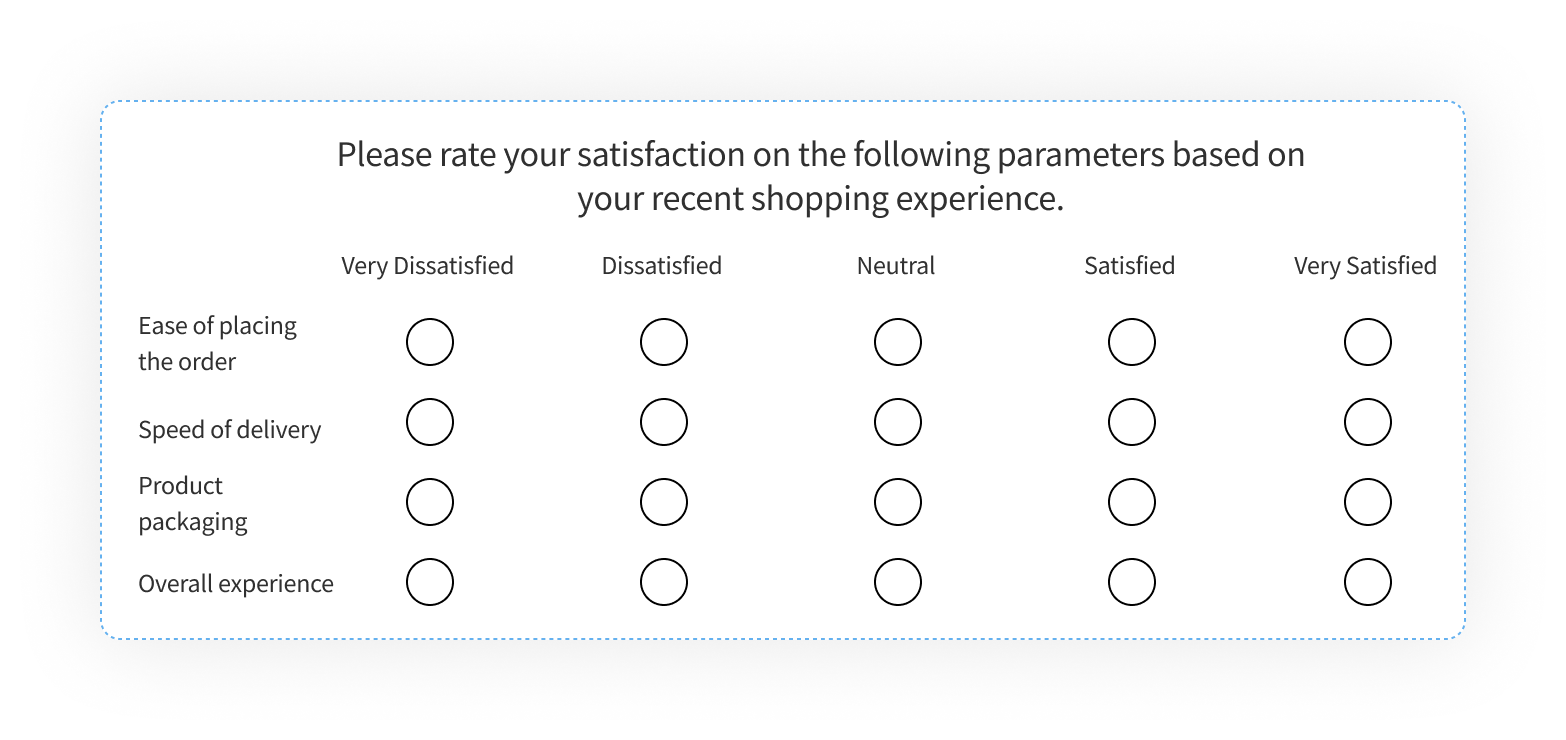
The 1-5 scale is fundamentally about capturing degrees of agreement, satisfaction, frequency, or importance. A “1” typically represents the lowest point on the spectrum (e.g., Strongly Disagree, Very Dissatisfied, Never), while a “5” signifies the highest (e.g., Strongly Agree, Very Satisfied, Always). The points in between provide a nuanced progression, allowing for a more detailed understanding than a simple yes/no question. To truly leverage this format, the key lies in formulating questions that are clear, unambiguous, and directly related to the specific aspect you wish to measure.
For instance, instead of asking a vague question like “Do you like our service?”, a more effective 1-5 scale question would be “How satisfied are you with the responsiveness of our customer service team?” with options ranging from 1 (Very Dissatisfied) to 5 (Very Satisfied). Precision in your questioning guides respondents to provide more accurate and meaningful feedback. Avoid leading questions or those that are double-barreled, meaning they try to ask two things at once. Each question should focus on a single, measurable concept to ensure the data you collect is clean and actionable.
Consistency in how you define your scale points across different questions is also crucial. If ‘1’ means ‘Strongly Disagree’ in one question, it shouldn’t suddenly mean ‘Not at all important’ in another within the same survey unless explicitly stated. Establishing clear anchors for each numerical value (e.g., 1=Poor, 2=Fair, 3=Good, 4=Very Good, 5=Excellent) ensures that all respondents interpret the scale similarly, leading to more reliable data. This thoughtful approach to question and scale design is what elevates a basic questionnaire into a powerful data-gathering instrument.
Tips for Designing Your 1-5 Scale Questions
- Be Specific: Focus each question on a single, clear aspect. Avoid generalities.
- Keep it Neutral: Phrase questions objectively to avoid biasing responses.
- Define the Scale: Clearly label the meaning of 1 and 5, and optionally intermediate points, especially if they deviate from common understanding.
- Test Your Questions: Run a small pilot test to ensure questions are understood as intended.
By adhering to these principles, you can significantly enhance the quality of the data collected from your 1-5 scale surveys. A well-constructed survey template scale 1 5 isn’t just about putting numbers on a page; it’s about building a bridge to genuine customer or employee insights.
Maximizing Insights from Your 1-5 Scale Data
Collecting data with a 1-5 scale survey is just the first step; the real value emerges from analyzing and interpreting the responses. Because the data is quantitative, you can easily calculate averages, medians, and modes for each question, providing a quick snapshot of overall sentiment. For example, if the average score for “Ease of Use” is 4.7, it suggests high satisfaction, while a score of 2.1 for “Technical Support Availability” indicates a significant area for improvement. These numerical summaries are incredibly powerful for identifying strengths and weaknesses at a glance.
Beyond simple averages, delve deeper by looking at the distribution of responses. Are most people clustered around 4s and 5s, or is there a significant number of 1s and 2s that might be masked by a moderate average? Visualizing the data through bar charts or histograms can reveal these patterns more clearly, highlighting areas where opinions might be polarized or where there’s a strong consensus. Understanding the spread of responses is often more informative than just looking at a single average score.
Consider segmenting your data based on demographics or other relevant categories. For instance, you might analyze how satisfaction scores differ between new customers and long-term customers, or between different age groups or geographical regions. This segmentation can uncover specific pain points or areas of delight for particular user segments, allowing for targeted interventions and improvements. The insights gained from such detailed analysis are invaluable for strategic decision-making and resource allocation.
Finally, remember that the goal of any survey is to drive action. Once you’ve analyzed your survey template scale 1 5 data and identified key trends or issues, translate these insights into concrete steps. Whether it’s refining a product feature, enhancing a service, or improving internal processes, the feedback you gather should inform tangible changes. Regularly repeating surveys allows you to track progress over time, measuring the impact of your actions and ensuring continuous improvement. This iterative process of feedback, analysis, and action is what makes surveys truly effective.
The simplicity and quantifiable nature of a 1-5 scale make it an indispensable tool for anyone seeking meaningful feedback. By thoughtfully designing your questions and meticulously analyzing the responses, you can unlock a wealth of insights that drive informed decisions and foster continuous improvement. It provides a straightforward yet powerful mechanism to understand perceptions and experiences, translating them into actionable strategies.
Embracing this versatile scale empowers you to not only measure what matters but also to track progress and demonstrate the impact of your efforts. The data collected from these surveys serves as a guiding light, illuminating paths to enhance satisfaction, optimize operations, and achieve your organizational goals with clarity and precision.


